
Easier access to scientific data

Brought to you by NOAA CoastWatch Great Lakes Node
|
ERDDAP
Easier access to scientific data |
|
Brought to you by NOAA CoastWatch Great Lakes Node |
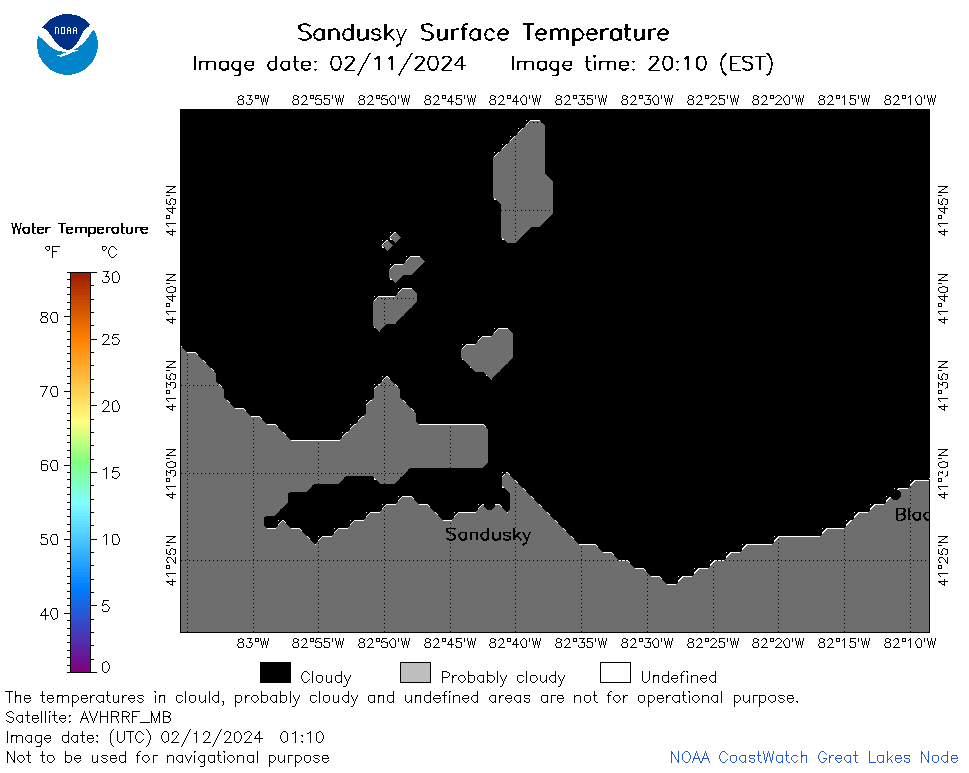
| Dataset Title: | Lake Erie Sandusky Surface Temperature Contour Map (2022-present)


|
| Institution: | CoastWatch Great Lakes Node (Dataset ID: LE_NRT_TC_e12) |
| Information: | Summary
| License
| Metadata
| Background | Subset
| Data Access Form
| Make a graph
| Subset
| Data Access Form
| Make a graph
|
![[ICO]](https://apps.glerl.noaa.gov/erddap/images/fileIcons/blank.gif) | Name | Last modified | Size | Description |
|---|---|---|---|---|
![[DIR]](https://apps.glerl.noaa.gov/erddap/images/fileIcons/back.gif) | Parent Directory | - | - | |
![[IMG]](https://apps.glerl.noaa.gov/erddap/images/fileIcons/image2.gif)  | e12_2024_02_12_0100.png | 12-Feb-2024 07:44 | 18892 | |
 | e12_2024_02_12_0110.png | 12-Feb-2024 07:51 | 18196 | |
 | e12_2024_02_12_0200.png | 12-Feb-2024 07:57 | 33557 | |
 | e12_2024_02_12_0240.png | 12-Feb-2024 08:04 | 44052 | |
 | e12_2024_02_12_0250.png | 12-Feb-2024 08:10 | 18170 | |
 | e12_2024_02_12_0340.png | 12-Feb-2024 08:16 | 18885 | |
 | e12_2024_02_12_0600.png | 12-Feb-2024 10:31 | 18166 | |
 | e12_2024_02_12_0740.png | 12-Feb-2024 12:31 | 26509 | |
 | e12_2024_02_12_0920.png | 12-Feb-2024 17:31 | 18179 | |
 | e12_2024_02_12_1410.png | 12-Feb-2024 17:38 | 18149 | |
 | e12_2024_02_12_1500.png | 12-Feb-2024 17:44 | 27187 | |
 | e12_2024_02_12_1550.png | 12-Feb-2024 18:34 | 30489 | |
 | e12_2024_02_12_1640.png | 12-Feb-2024 19:31 | 18870 | |
 | e12_2024_02_12_1820.png | 12-Feb-2024 20:38 | 25312 | |
 | e12_2024_02_12_1730.png | 12-Feb-2024 21:34 | 25320 | |
 | e12_2024_02_12_1910.png | 13-Feb-2024 00:31 | 30044 | |
 | e12_2024_043.png | 13-Feb-2024 11:07 | 31696 | |